

Technical analysis is a method used by crypto traders to predict future price movements in the market by analyzing charts and historical data. It is a popular tool used by crypto traders in traditional markets such as stocks, forex, and commodities, and the same analysis can also apply to the cryptocurrency market. This article will provide a comprehensive introduction to the basics of technical analysis, including reading cryptocurrency chart patterns, using technical indicators, and how to use them to predict price movements in the crypto market or crypto charts.
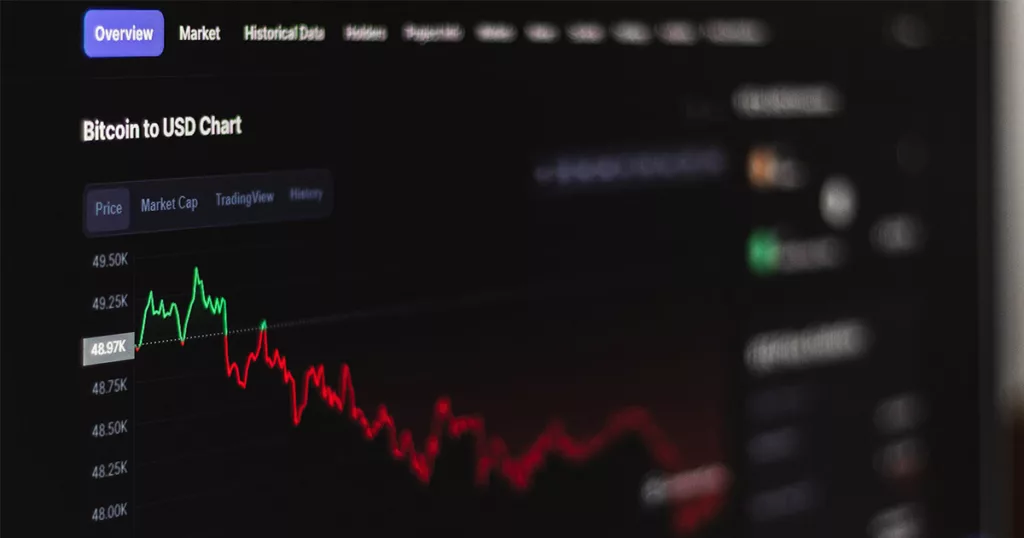
Cryptocurrency charts play a critical role in any crypto trader or investor’s success. Understanding how to interpret these charts and what they mean is essential to making informed decisions when day trading crypto. Charts can illustrate any given asset’s current market trends, price levels, and historical performance. They also provide insight into the overall sentiment of the cryptocurrency market, crypto signals, and volatility.
By studying these charts, traders can better identify buying and selling opportunities and potential risks associated with each investment decision. Additionally, by understanding vital technical indicators such as support and resistance levels, traders can develop strategies for entering or exiting trades at optimum points to maximize profits and minimize losses by correctly identifying the relevant crypto signal.
Here are the 7 Technical Analysis terms you should master before buying crpyto:
Chart patterns are a crucial aspect of technical analysis in cryptocurrencies. They are visual representations of the market’s behaviour and can help traders and technical analysts identify potential trends and predict future price movements. Some common yet different chart patterns include head and shoulders patterns, double top and bottom patterns, and trend lines.
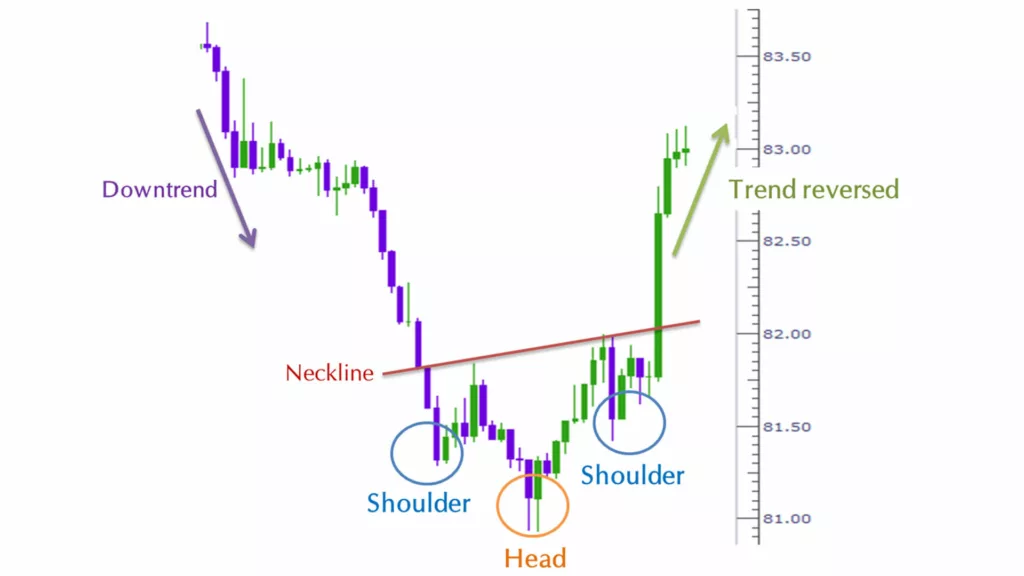
Head and shoulders patterns are bearish reversal pattern that forms after an uptrend. It is characterized by a peak (left shoulder), followed by a higher peak (head), and then a final peak (right shoulder) that is lower than the head. This pattern indicates that the market is reaching the top and is likely to move downward. To identify the head and shoulder pattern, it’s essential to look for a peak, a higher peak, and a lower peak. The neckline is drawn by connecting the lows of the two bottoms. If the price breaks below the neckline, it confirms the bearish reversal pattern.
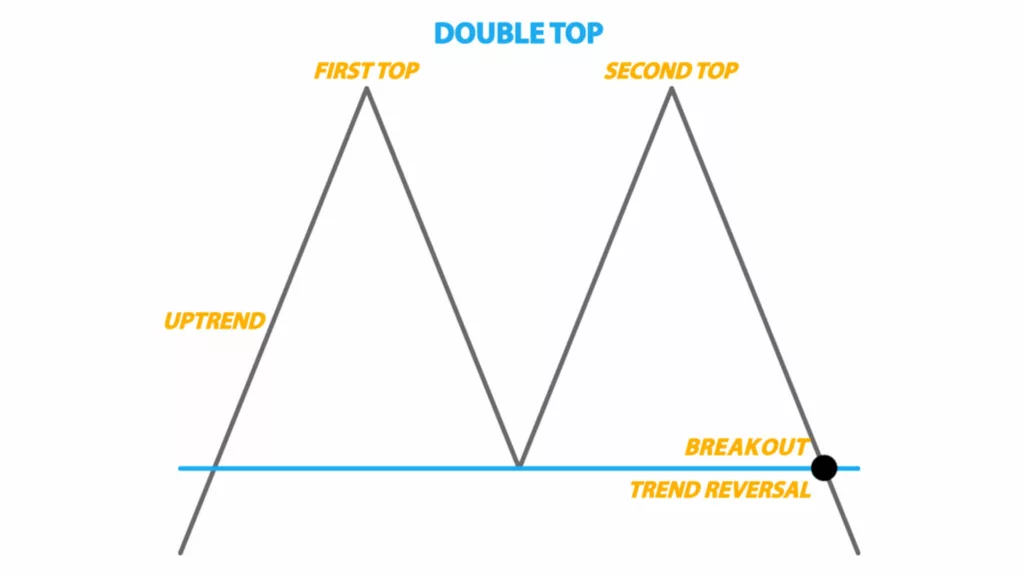
Double tops and bottoms, also known as “M” and “W” patterns, are reversal patterns that indicate a potential trend change. A double top forms after an uptrend and is characterized by two peaks at the same or similar levels. Two troughs characterize a double bottom form after a downtrend and at the same or similar levels.
These patterns suggest that the market is reaching a resistance or support level and is likely to change direction. To identify the double top and bottom pattern, looking for two highs or lows at the same level or close to each other is essential. The neckline is drawn by connecting the double bottom’s lows or the double top’s highs. If the price breaks down below the neckline in the case of double top and above in the case of double bottom, it confirms the trend reversal pattern.
Trend lines are used to identify trends and potential support and resistance levels. They are created by connecting two or more price points and are used to predict where the market will likely head. To identify a trend line, it’s essential to look for a minimum of two highs or lows and then connect them with a straight line. This line represents the trend; if the price breaks above or below, it confirms the trend change.
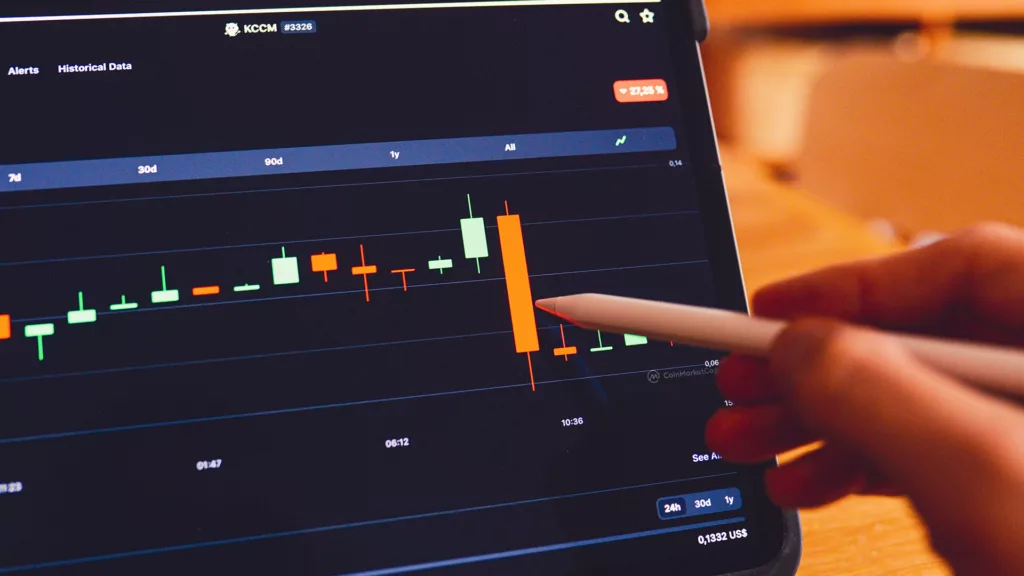
Candlestick diagrams are a widely-employed kind of chart used in technical analysis. They are often used to visualize price movements in the market and can provide valuable insights into the behaviour of buyers and sellers. Candlestick charts are composed of a series of cand sticks, each representing the price action for a specific period.
Each cand stick is composed of a body and one or two shadows. The body represents the range between the open and closed prices, while the shadows represent the high and low prices. If the body is filled or coloured, the close price is lower than the open price, indicating a bearish trend. If the body is hollow, the close price is higher than the open price, indicating a bullish trend.
Some popular stick patterns include the Doji, which indicates indecision in the market, and the hammer and hanging man, which indicates potential trend reversals. Traders often look for these patterns with other indicators and chart patterns to predict future price movements. Traders and analysts widely use candlestick charts because they provide a clear and concise picture of the market.
Candlestick charts are a popular tool used in technical analysis for visualizing price movements in the crypto market. They display time across the horizontal axis and private data on the vertical axis, similar to line and bar graphs. The main difference is that candlesticks show whether the market’s price movement was positive or negative in a given period and to what degree.
Crypto market charts can be set to different timeframes, with candlesticks representing that timeframe. For example, if a crypto trading chart is set to a four-hour timeframe, each candlestick will represent four hours of trading activity. The timeframe selected for trading is based on an individual trader’s approach and tactics.
A candlestick is composed of a body and wicks. The body represents the opening and closing prices, the top wick represents the highest price reached during the timeframe, and the bottom wick represents the lowest price. Candlesticks may also be coloured green or red. Green candles indicate the price went up over the period, while red candles indicate the price declined.
The simple structure of candlesticks can provide a lot of information. Technical analysts may use candlestick patterns to identify potential trend reversals, and traders should be aware of bullish and bearish patterns. For example, a long wick at the top of a candle’s body may suggest traders are taking profits, and a sell-off may occur soon. Conversely, a long wick at the bottom could mean traders buy the asset every time the price drops.
Additionally, a candlestick with a large body and short wicks may indicate strong bullish or bearish sentiment, depending on the candle’s colour. On the other hand, a candlestick with almost nobody and long wicks signals that neither buyer.
Indicators are mathematical calculations based on the market’s price or volume. These charts provide additional information about the market, and traders can make more informed decisions. Some best indicators for crypto trading used in technical analysis include moving averages, relative strength index (RSI), stochastic oscillators, and Bollinger Bands.
Moving averages are used to identify trends and potential support and resistance levels. They are determined by computing the mean of a specific quantity of preceding cost levels. The two most prevalent types of moving averages are the Simple Moving Average (SMA) and the Exponential Moving Average (EMA). The SMA is calculated by taking the sum of the closing prices for specific periods and then dividing it by the number of periods. The EMA is calculated by giving more weight to the recent prices.
A moving average is a statistical indicator used to analyze data points by creating a series of averages of different subsets of the data. It smooths out short-term fluctuations and highlights longer-term trends or cycles. Moving averages are generally used to identify support and resistance levels, as well as to gauge momentum and define the overall trend. Moving Averages may also use them to buy and sell signals.
As prices fluctuate over time, or there can be periods of high volatility, moving averages can help investors determine when it is best to enter and exit a trade. By analyzing the price action about its moving average, traders use it to gain insight into the direction of the price of a cryptocurrency in the market.
A short-term moving average, such as a 10-day or 20-day moving average, is used to identify the short-term trend, while a long-term moving average, such as a 200-day or 50-day moving average, is used to identify the long-term trend. The golden cross is a bullish signal formed when a short-term moving average crosses above a long-term moving average. The death cross is a bearish signal formed when a short-term moving average crosses below a long-term moving average.
The relative strength index (RSI) is a momentum indicator that compares the magnitude of recent gains to recent losses. It is used to identify overbought and oversold conditions and to predict potential trend changes. RSI ranges between 0 and 100; a value above 70 is considered overbought, and a value below 30 is considered oversold. A bullish divergence occurs when the RSI forms a higher low while the price forms a lower low, and a bearish divergence occurs when the RSI forms a lower high while the price forms a higher high.
The Relative Strength Index (RSI) is a popular technical indicator used in cryptocurrency trading to measure the strength of a market’s price action. It compares the magnitude of recent gains to recent losses, creating an index that ranges from 0 to 100. A value above 70 is considered overbought, indicating that the market may be due for a price correction. In contrast, a value below 30 is considered oversold, indicating that the market may be due for a price increase.
The RSI is a momentum oscillator that can detect overbought or oversold conditions and spot divergences between the RSI and the crypto market price. Traders often use the RSI in conjunction with other indicators and chart patterns to make more informed trading decisions and can help investors to identify potential trend reversals.
A stochastic oscillator is a momentum indicator used in technical analysis to indicate the direction of price movement. It is calculated by comparing closing prices over a specific period to the range of prices over that same time. The oscillator varies between 0 and 100, with readings above 80 typically indicating an overbought condition and readings below 20 indicating an oversold condition.
In cryptocurrency trading, traders use the stochastic oscillator to help identify their trades’ potential entry and exit points. By analyzing the price change rate from one period to the next, traders can determine when a cryptocurrency might be due for a reversal or pullback. Furthermore, traders can use it to assess trends and gauge whether a particular asset is undervalued or overvalued relative to its historical range. Ultimately, the stochastic oscillator is an essential tool for traders looking to analyze the market and make more informed decisions about when to enter or exit trades.
In technical analysis, support and resistance levels are vital to identify potential buy and sell opportunities in the cryptocurrency market. Support refers to a level at which the price of an asset is expected to find buying interest, while resistance refers to a level at which the price of an asset is expected to find selling pressure.
Support and resistance levels are often identified by analyzing past price action and identifying areas where the price has struggled to break through. These levels can be represented by horizontal lines on a chart and identified using trendlines and other technical indicators.
Traders often use support and resistance levels to determine their entry and exit points in a trade. Suppose the price of an asset is approaching a level of resistance. In that case, it may be an excellent opportunity to sell, while if the price is approaching a level of support, it may be an excellent opportunity to buy.
It’s important to note that support and resistance levels are not exact numbers, and the price may sometimes react differently than expected. Traders should also be aware of the potential for these levels to be broken, as a break above resistance can indicate a bullish trend, and a break below support can indicate a bearish trend.
Understanding support and resistance levels are crucial for traders as it helps them identify critical levels in the market where the price is likely to change its direction, giving them a better chance to make profitable trades.
Bollinger Bands are a technical analysis tool utilized to evaluate market instability. John Bollinger created them in the 1980s, consisting of three bands plotted against a security price. The two outer bands are usually two standard deviations from a moving average of the security’s price, while the middle band is usually the simple moving average. By measuring the distance between the bands, traders can see how far prices have moved away from their average range – if they move too far, it indicates that prices may be due for a correction.
Bollinger Bands also help traders spot entry and exit points for trades and identify overbought and oversold conditions in the market. Bollinger Bands can also identify potential trend reversals by looking for a break out of the bands. Traders often use Bollinger Bands with other indicators and chart patterns to make more informed trading decisions and identify potential buy and sell opportunities.
To use technical analysis to predict price movements in the crypto market, traders can use a combination of chart patterns, indicators, and other tools. Some basic steps to follow include:
Technical analysis is a powerful tool that cryptocurrency traders can use to predict future price movements in the market. By understanding the basics of chart patterns, and indicators and how to use them in combination, traders can better understand the market and make more informed decisions. However, it is essential to note that technical analysis should not be used in isolation and should always be used in conjunction with other forms of analysis, such as fundamental analysis. Additionally, It’s always important to keep in mind that the crypto market is highly volatile and unpredictable, so it’s always advisable to have a proper risk management strategy.
The above article is a comprehensive guide to technical analysis for cryptocurrency traders, which can help them find the best opportunities to invest in crypto. It includes chart patterns, indicators, and how to use them to predict price movements in the crypto market. Technical analysis can help traders better understand the market and make better trading decisions.

Leading Crypto Trading School for Amateurs and Experts.